


Non-contact IV tester

Quantum Efficiency Tester
Accurate EQE, IQE and spectral response measurements—from localized spots to full cells.
The MNPVQE-1800T PRO is designed for photovoltaic research and production, providing accurate measurements of solar cell spectral response, external quantum efficiency (EQE/IPCE) and internal quantum efficiency (IQE). The MNPVQE-1800T PRO supports a wide range of photovoltaic devices, including crystalline silicon, multicrystalline silicon, amorphous silicon, microcrystalline silicon, CdTe, CIGS, CIS, Ge, dye-sensitized, organic/polymer, tandem, multijunction, quantum-well, quantum-dot, chalcogenide and perovskite solar cells.PL/EL Integrated System
PV-Reflectumeter
3D Confocal Microscope
In-Line Four Point Probe Tester
Four Point Probe Tester
In-Line Thin Film Thickness Tester
Raman Spectrometer
FTIR Spectrometer
Spectrophotometer
Automatic Spectroscopic Ellipsometer
Contact Resistance Tester
Ultra depth of field 3D microscope
Auto Visual Tester
VMM PV Vision Measuring Machine
Solar Cell Horizontal Tensile Tester
Steady State Solar Simulator for Solar Cell
Solar Cell UV Aging Test Chamber
Solar Cell Comprehensive Tensile Tester
Visual Inspection Tester
Wet Leakage Current Tester
PV Module EL Tester
PV Module UV Preconditioning Chamber
Steady State Solar Simulator for PV Module
Current Continuous Monitor
Potential Induced Degradation Test
Bypass Diode Tester
LeTID Test System
Reverse Current Overload Tester
Impulse Voltage Tester
Hipot Insulation Tester
Ground Continuity Tester
Hipot Insulation Ground Tester
Damp Heat Test Chamber
Humidity Freeze Test
Thermal Cycle Test Chamber
Dynamic Mechanical Load Tester
Static Mechanical Load Tester
Hail Impact Tester
Robustness of Termination Tester
Module Breakage Tester
Cut Susceptibility Tester
Peel Shear Strength Tester
Universal Testing Machine (Single-arm)
Universal Testing Machine (Double-arm)
Glass Transmittance Tester
Acetic Acid Test Chamber
EVA Degree of Crosslinking Test System
Junction Box Comprehensive Tester
Drop ball tester
Semi-automatic scanning four-probe tester
Stylus Profilometer
Maximum Power Point Tracker
Perovskite Glass Transmittance Tester
Perovskite P1 Laser Scribing Multifunctional Testing Machine
Perovskite Online PL Tester
Perovskite Online Sheet Resistance Tester
Online Perovskite Film Thickness Tester
Perovskite Process Inspection Workstation
Portable EL Tester
Portable Thermal Imaging Tester
Solar Module Multi-Channel Testing System
PV Inverter Power Quality Tester
IV Tester
IVEL Cell Sorting Machine
Front-Side Laser Cutting of N-TOPCon Half-Cells: PL/EL Reveals Phosphorus Diffusion and Cutting Yield
Date : 18 November 2026Views : 40
As the core components of photovoltaic modules, solar cells directly affect module power and reliability through their manufacturing processes. To enable flexible module voltage/current designs and accommodate the trend toward larger crystalline-silicon cells, cells are separated into smaller pieces. Half-cell technology has therefore become mainstream. Thermal laser separation (TLS) is widely used because of its low thermal damage and high cutting yield. However, conventional rear-side cutting may create additional leakage sites and reduce cell efficiency. This article compares front-side and rear-side cutting experimentally. PL/EL imaging with the Millennial Solar integrated PL/EL System helps reveal the advantages and underlying mechanism of front-side cutting, providing a reference for optimizing N-TOPCon cell singulation.
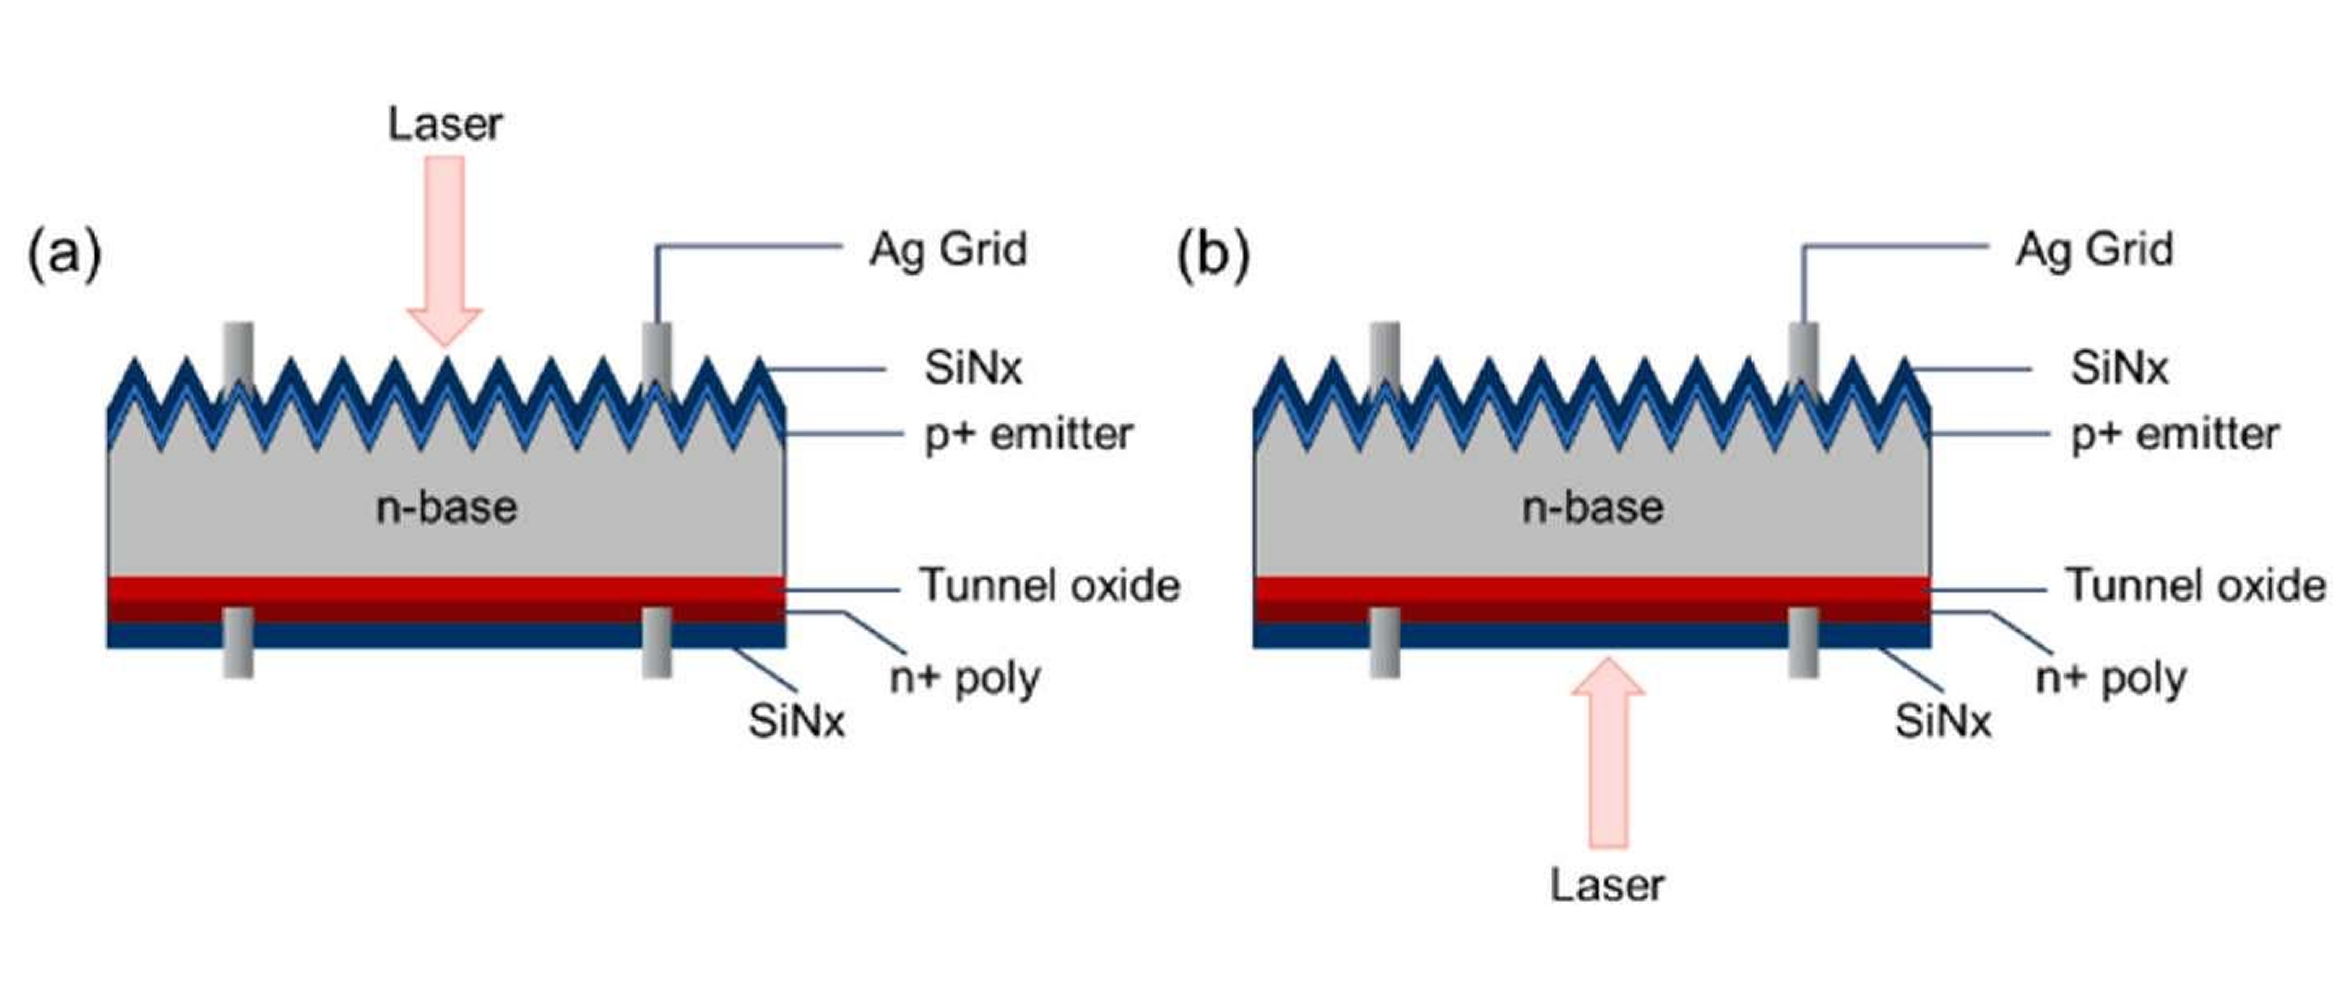
Laser cutting direction: (a) front-side cutting; (b) rear-side cutting.
The study used 210 mm × 182 mm N-TOPCon cells, a 1,064 nm grooving laser, and a heating laser with a 2.0 mm beam diameter. Scanning electron microscopy (SEM) was used to observe surface morphology; energy-dispersive X-ray spectroscopy (EDS) to analyze elemental diffusion; I–V testing to assess electrical performance; photoluminescence (PL) to evaluate edge recombination; and electroluminescence (EL) to assess module quality.
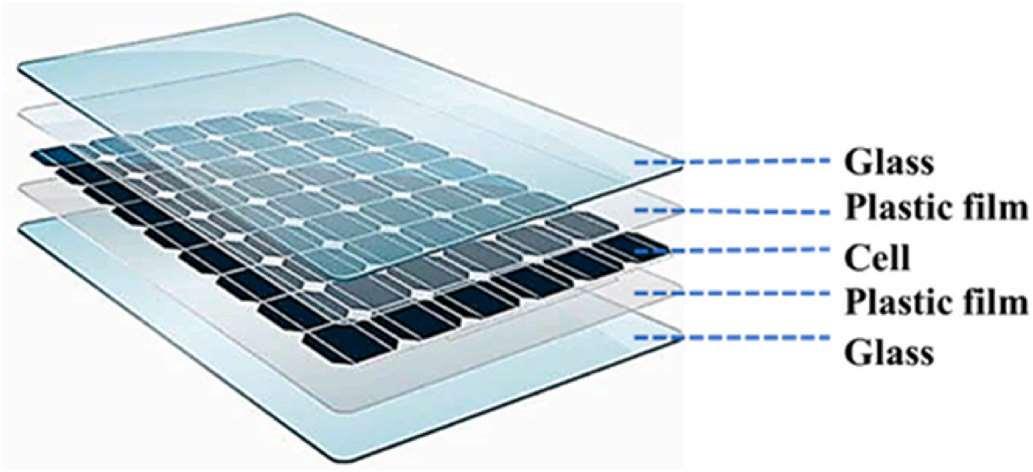
Schematic of photovoltaic module encapsulation.
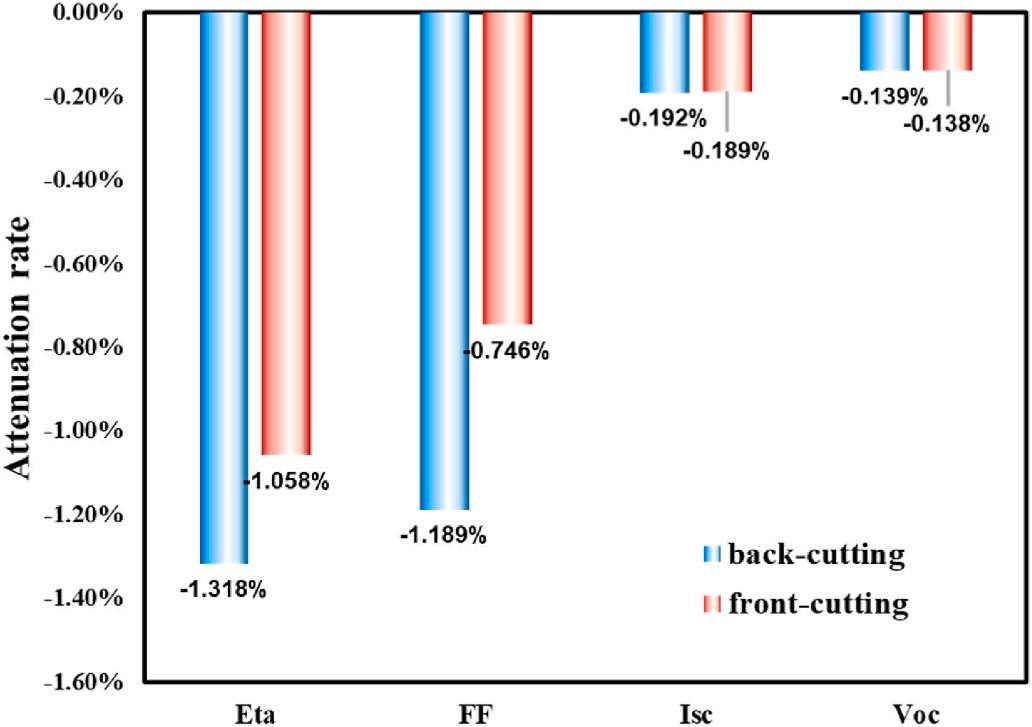
Comparison of solar-cell I–V performance after front-side and rear-side cutting.
Cell I–V performance: Cell efficiency (Eta), short-circuit current (Isc), and other parameters decreased slightly after both front-side and rear-side cutting. However, the efficiency attenuation rate for rear-side cutting was approximately 0.26 percentage points greater than for front-side cutting, mainly because rear-side cutting caused a larger fill-factor (FF) loss associated with current leakage.
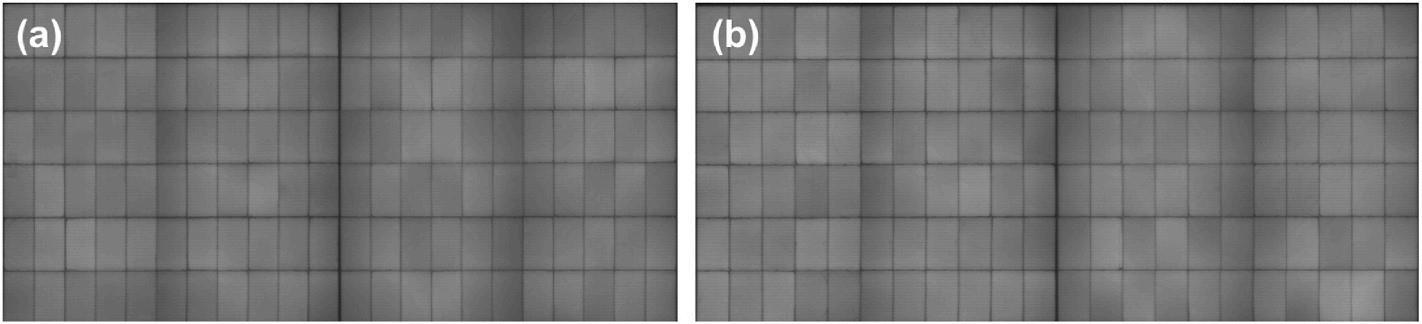
Module EL images: (a) rear-side cutting; (b) front-side cutting.

Comparison of electrical performance parameters of modules made with front-side and rear-side cutting.
Module IV performance: Module tests showed that the average power of modules made with front-side cutting was 0.3 W higher than that of modules made with rear-side cutting. The EL images showed no significant differences. Overall, front-side cutting outperformed rear-side cutting in these tests.
Groove morphology (SEM): The front-side cutting groove was 1.9 mm wide, and the heat-affected zone extended through 60% of the cell thickness. The edges were smooth, without microcracks.
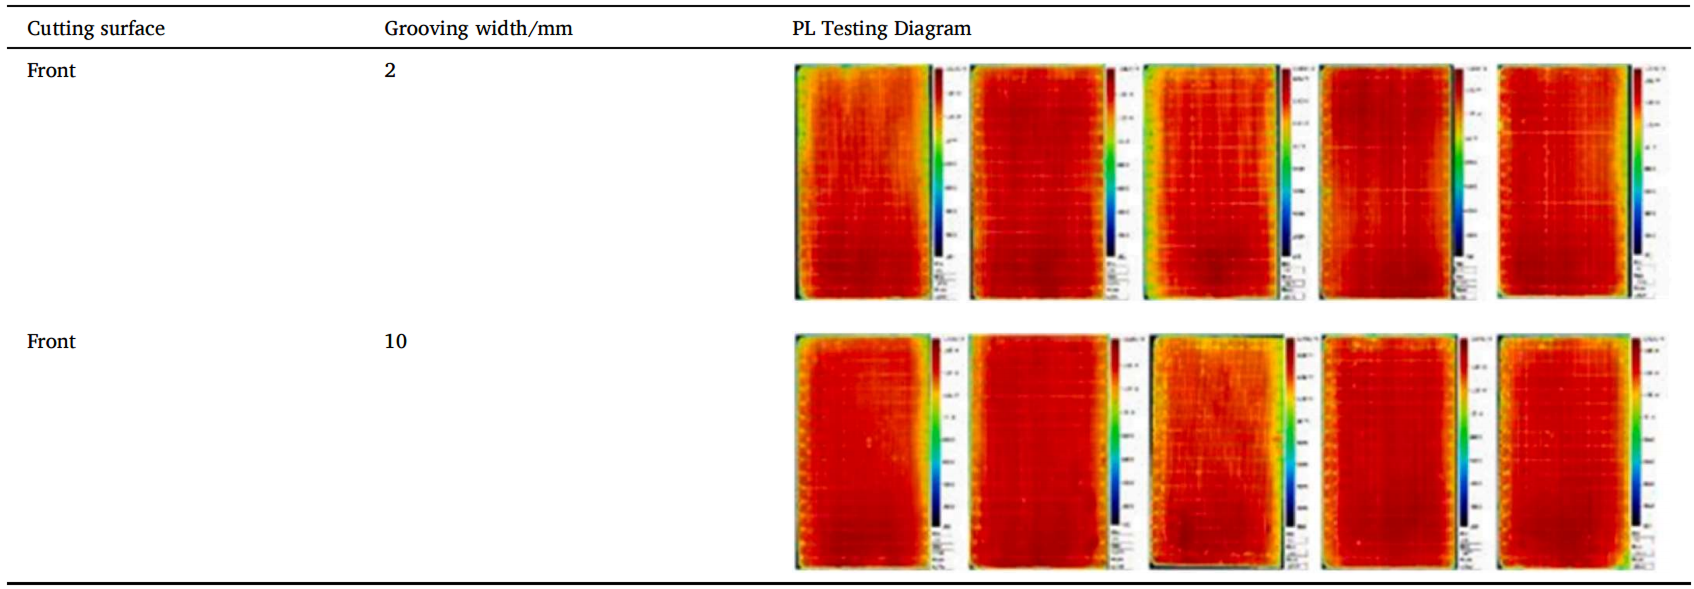
PL measurement results for front-side-cut cells (grooving widths of 2 mm and 10 mm).
Edge recombination (PL): The PL brightness at front-side-cut edges was consistent with that in uncut regions, indicating low recombination losses.
Reverse-bias leakage current: Front-side cutting produced lower leakage current with less variation between measurements.
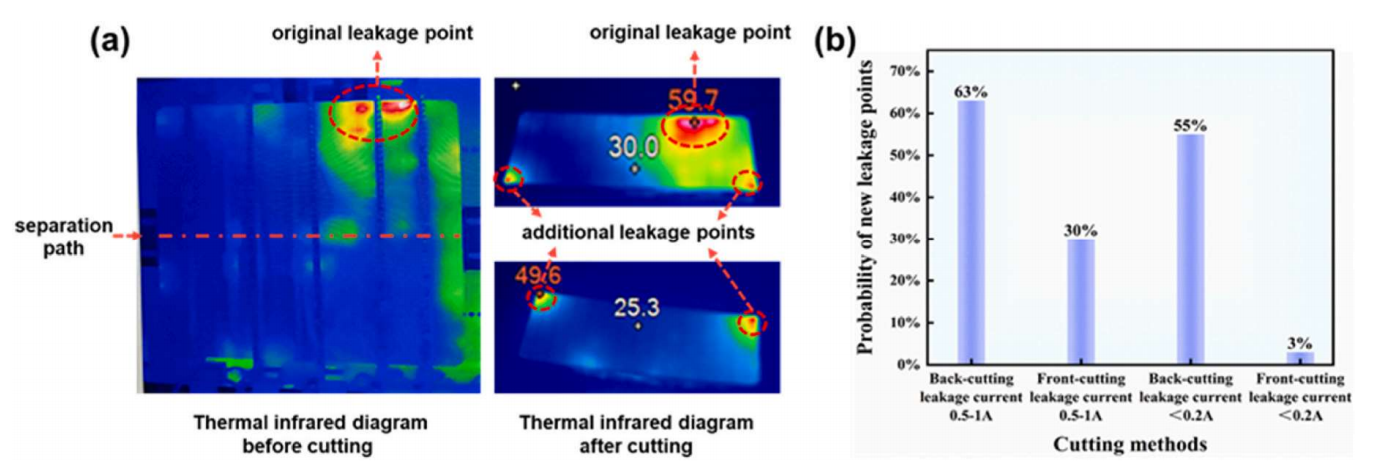
(a) Distribution of newly formed leakage sites before and after laser cutting; (b) probability of new leakage-site formation.
Probability of new leakage-site formation:
High-leakage cells (0.5–1 A): 30% with front-side cutting versus 63% with rear-side cutting.
Low-leakage cells (<0.2 A): 3% with front-side cutting versus 12% with rear-side cutting.
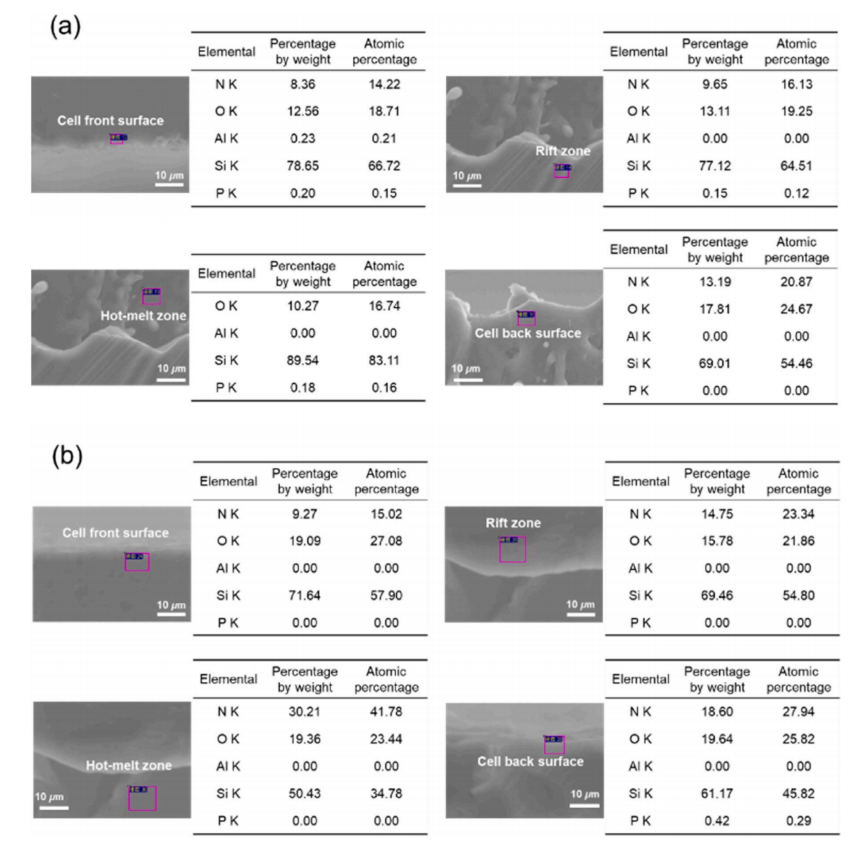
Cell SEM–EDS images: (a) rear-side cutting; (b) front-side cutting.
Elemental diffusion (EDS): Phosphorus was detected in the heat-affected zone after rear-side cutting, originating from diffusion of the rear phosphorus-doped layer. With front-side cutting, residual phosphorus was detected only on the rear side.
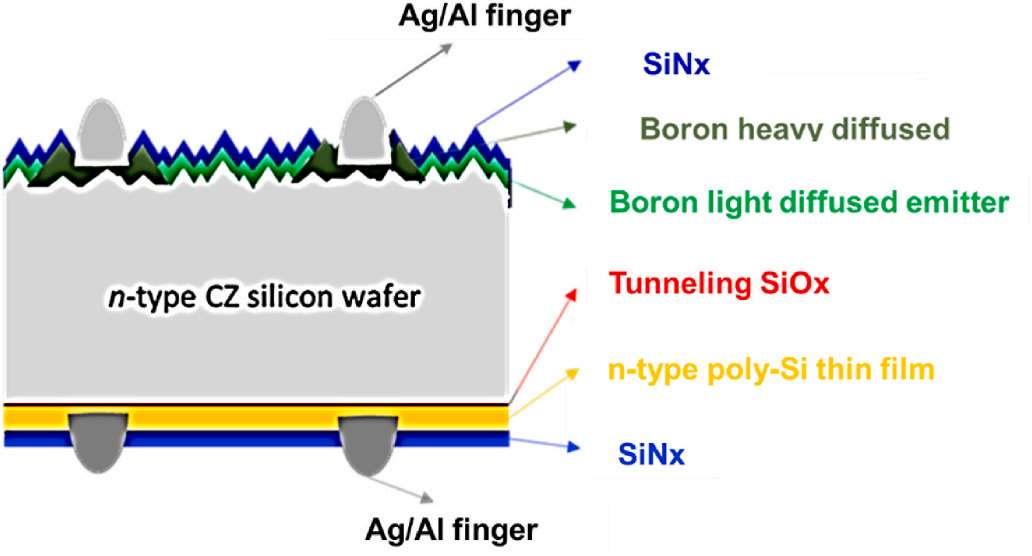
Schematic structure of an N-TOPCon solar cell.
This study identifies phosphorus diffusion as a key mechanism behind the formation of leakage sites near the grooves at both ends of cells subjected to conventional rear-side cutting, and proposes front-side TLS cutting as an alternative. The experiments showed that front-side cutting substantially reduced reverse-bias leakage current, improved measurement consistency and breakdown stability, and increased average module power by approximately 0.3 W, supporting more effective N-TOPCon cell singulation.
The study indicates that front-side cutting of N-TOPCon cells can be applied to existing production lines without additional modifications, improving post-cut cell efficiency and cutting yield.
EDS analysis linked rear-side cutting to phosphorus diffusion into the heat-affected zone, which contributed to new leakage sites. Front-side cutting produced lower reverse-bias leakage current.
Q2: How did front-side cutting affect module power?Modules made with front-side-cut cells had approximately 0.3 W higher average power than those made with rear-side-cut cells, while EL images showed no significant differences.
Q3: How did cutting direction affect the probability of new leakage sites?For high-leakage cells, the probability was 30% with front-side cutting versus 63% with rear-side cutting. For low-leakage cells, it was 3% versus 12%.
E-mail: market@millennialsolar.com
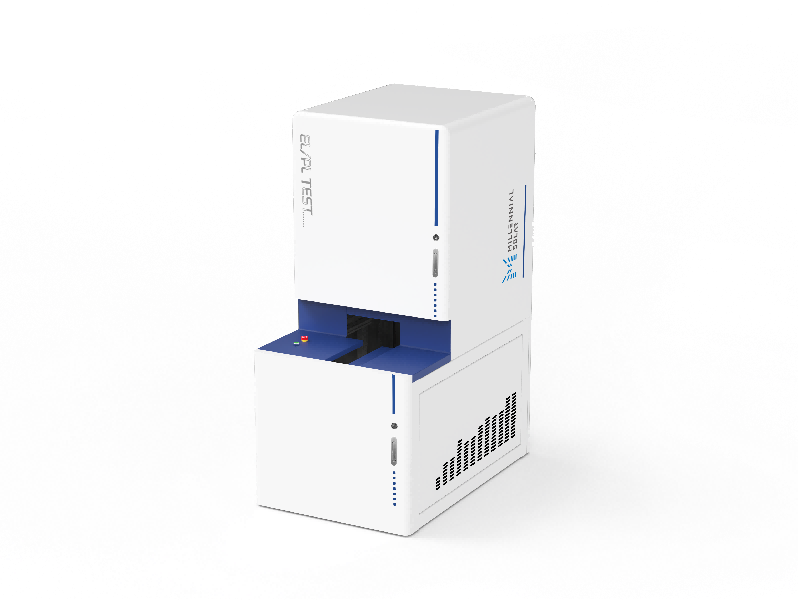
Millennial Solar integrated PL/EL System uses simulated sunlight to illuminate perovskite solar cells uniformly and captures photoluminescence (PL) signals through specialized optics to generate PL images. It also captures electroluminescence (EL) signals for EL imaging. Image-processing algorithms and software analyze the captured PL/EL images, identify defects, and classify and summarize them according to their characteristics.
PL/EL imaging with 5-megapixel resolution and selectable imaging precision.
Spectral response range: 400–1,200 nm.
PL light source: Blue light (customizable source size, wavelength, etc.).
Customizable detection and analysis of various defects, including pitting, dark areas, and edge intrusion.
The PL/EL imaging capabilities of the Millennial Solar integrated PL/EL tester help examine the mechanisms behind differences between front-side and rear-side cutting of N-TOPCon cells at both microscopic and macroscopic scales, providing a practical technical approach to improving photovoltaic module power.
Original Research Reference: A comparative experimental study on front and back laser cutting technology for mass separation of N-TOPCon crystal silicon solar cells
Related Products


