
Quantum Efficiency Tester
PL/EL Integrated System
PV-Reflectumeter
3D Confocal Microscope
In-Line Four Point Probe Tester
Four Point Probe Tester
In-Line Thin Film Thickness Tester
Raman Spectrometer
FTIR Spectrometer
Spectrophotometer
Automatic Spectroscopic Ellipsometer
Contact Resistance Tester
Ultra depth of field 3D microscope
Auto Visual Tester
VMM PV Vision Measuring Machine
Solar Cell Horizontal Tensile Tester
Steady State Solar Simulator for Solar Cell
Solar Cell UV Aging Test Chamber
Solar Cell Comprehensive Tensile Tester
Visual Inspection Tester
Wet Leakage Current Tester
PV Module EL Tester
PV Module UV Preconditioning Chamber
Steady State Solar Simulator for PV Module
Current Continuous Monitor
Potential Induced Degradation Test
Bypass Diode Tester
LeTID Test System
Reverse Current Overload Tester
Impulse Voltage Tester
Hipot Insulation Tester
Ground Continuity Tester
Hipot Insulation Ground Tester
Damp Heat Test Chamber
Humidity Freeze Test
Thermal Cycle Test Chamber
Dynamic Mechanical Load Tester
Static Mechanical Load Tester
Hail Impact Tester
Robustness of Termination Tester
Module Breakage Tester
Cut Susceptibility Tester
Peel Shear Strength Tester
Universal Testing Machine (Single-arm)
Universal Testing Machine (Double-arm)
Glass Transmittance Tester
Acetic Acid Test Chamber
EVA Degree of Crosslinking Test System
Junction Box Comprehensive Tester
Drop ball tester
Semi-automatic scanning four-probe tester
Stylus Profilometer
Maximum Power Point Tracker
Perovskite Glass Transmittance Tester
Perovskite P1 Laser Scribing Multifunctional Testing Machine
Perovskite Online PL Tester
Perovskite Online Sheet Resistance Tester
Online Perovskite Film Thickness Tester
Perovskite Process Inspection Workstation
Portable EL Tester
Portable Thermal Imaging Tester
Solar Module Multi-Channel Testing System
PV Inverter Power Quality Tester
Drone EL Tester
IV Tester
IVEL Cell Sorting Machine
N-TOPCon Half-Cell Front-Side Cutting Process: PL/EL Reveals Phosphorus Diffusion Mechanism to Improve Cutting Yield
Date : 3 September 2025Views : 3325
As the core component of photovoltaic modules, solar cells' manufacturing processes directly impact module power output and reliability. To accommodate flexible voltage/current design and the trend toward larger crystalline silicon cells, cells must be segmented into smaller pieces. Consequently, half-cell technology has become industry-standard, with Thermal Laser Separation (TLS) widely adopted for its low thermal damage and high cutting yield. However, traditional backside cutting may increase leakage points, compromising cell efficiency. This paper investigates the differences between front-side and back-side cutting through comparative experiments. The PL/EL imaging capability of Millennial PL/EL integrated tester reveals the advantages and underlying mechanisms of front-side cutting, providing reference for optimizing the cutting process of N-TOPCon cells.
Experimental Method
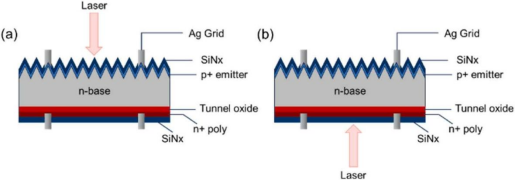
Laser Cutting Orientations: (a) Front-side cutting; (b) Back-side cutting
Using 210 mm × 182 mm N-TOPCon cells, the slotting laser wavelength is 1064 nm with a heating laser diameter of 2.0 mm. Surface morphology is observed via SEM, elemental diffusion is analyzed by EDS, electrical properties are tested through I–V measurements, edge recombination effects are evaluated by photoluminescence (PL), and module quality is verified by electroluminescence (EL).
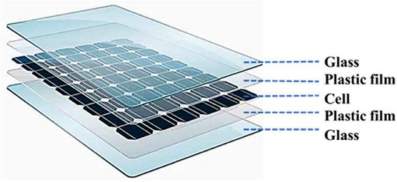
Photovoltaic Module Encapsulation Structure Schematic
Cell and Module I-V Performance
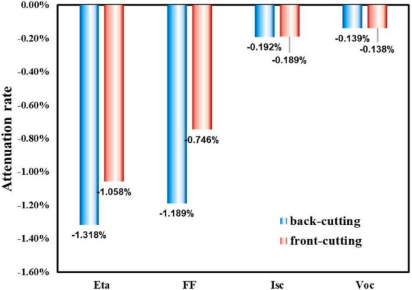
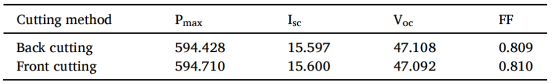
Comparison of I-V Performance Between Front- and Back-Cut Solar Cells
Cell I-V Performance: Parameters such as cell efficiency (Eta) and short-circuit current (Isc) showed slight decreases for both front-cut and back-cut cells. However, the Eta decay rate for back-cut cells was approximately 0.26% higher than that of front-cut cells. This primarily resulted from more significant fill factor (FF) loss in back-cut cells (related to current leakage).
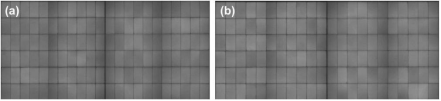
Module Electroluminescence (EL) Images: (a) Backside-cut; (b) Frontside-cut
Comparison of Electrical Performance Parameters Between Front-Cut and Back-Cut Modules
Module I-V Performance: Module testing revealed that front-cut modules exhibited an average power output 0.3W higher than back-cut modules, with no significant differences observed in EL images. Results indicate that the front-cut process outperforms the back-cut process.
Leakage Mechanism Analysis
Groove Morphology (SEM): Front-cut grooves exhibit a width of 1.9 mm, with the heat-affected zone occupying 60% of the cell thickness. Edges appear smooth with no microcracks.
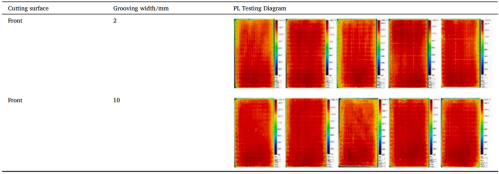
PL Test Results for Front-Cut Batteries (Slot Widths 2mm and 10mm)
Edge Recombination (PL Test): Front-cut edges exhibit brightness consistent with uncut areas, with minimal recombination loss.
Reverse-Bias Leakage Current: Front-cut batteries demonstrate lower leakage current and reduced data dispersion.
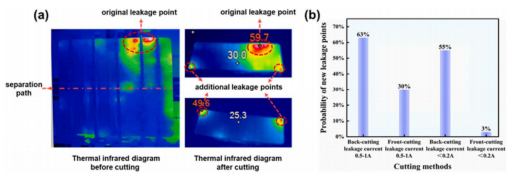
(a) Distribution of new leakage points before and after laser cutting; (b) Statistical probability of new leakage point formation
Probability of Leakage Point Generation:
High-Leakage Cells (0.5–1A): Probability of new leakage point on front side: 30% vs. 63% on back side.
Low-Leakage Cells (<0.2A): Probability on front side: only 3% vs. 12% on back side.
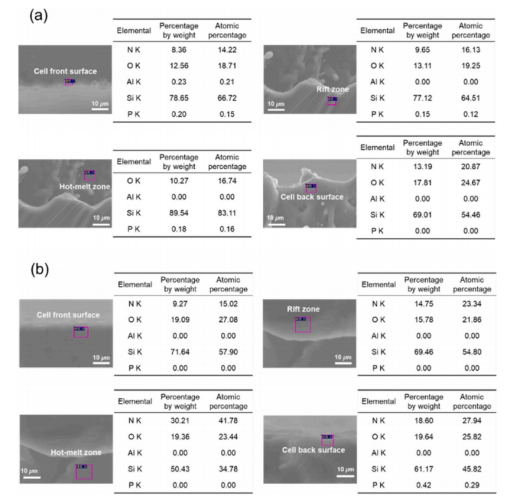
Battery SEM-EDS Images: (a) Back-side cut; (b) Front-side cut
Elemental Diffusion (EDS): Phosphorus (P) detected in the heat-affected zone of the back-side cut (originating from diffusion through the back-side phosphorus-doped layer). The front-side cut shows residual P only at the back-side interface.
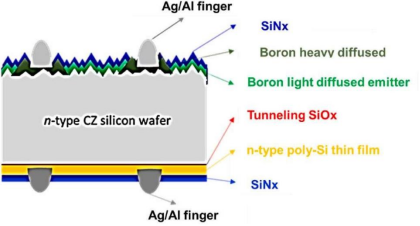
Schematic Diagram of N-TOPCon Solar Cell Structure
This study reveals that the core mechanism behind leakage points forming at the trenches on both ends of conventional back-side cut cells lies in phosphorus (P) diffusion. It innovatively proposes a front-side TLS cutting solution. Systematic experiments confirm that front-side cutting significantly reduces reverse-bias leakage current, enhances data convergence and breakdown stability, ultimately achieving a module power gain of approximately 0.3W. This provides technical support for efficient cutting of N-TOPCon cells.
The front-side cutting process for N-TOPCon cells can be directly applied to existing production lines without requiring additional modifications, thereby improving both cell efficiency and cutting yield post-processing.
Millennial PL/EL Integrated Tester
The Millennial PL/EL Integrated Tester simulates sunlight irradiation on perovskite solar cells, uniformly illuminating the entire sample. It captures photoluminescence (PL) signals using specialized lenses to generate PL imaging, and electroluminescence (EL) signals to produce EL imaging. Image algorithms and software process and analyze captured PL/EL images to identify defects, enabling analysis, classification, and summarization based on their characteristics.
email:market@millennialsolar.com
EL/PL imaging, 5 megapixels, with multiple imaging precision modes
Spectral response range: 400nm–1200nm
PL Light Source: Blue light (customizable light source size, wavelength, etc.)
Multiple defect recognition and analysis (pitting, darkening, edge intrusion, etc.) with customizable defect types
The PL/EL imaging technology of the Millennial PL/EL Integrated Tester can verify the causes of differences in front and back cutting processes for N-TOPCon cells at both microscopic and macroscopic levels, providing a feasible technical pathway for enhancing photovoltaic module power output.


